
Wind tunnel results
Proven gains
Road-tested first, then independently tunnel tested — not modelled on a spreadsheet. Every figure below is measured hoods to drops on the same rider, same bike, same day.
The move being measured: hands in from 42 cm to 33 cm, tops to drops.
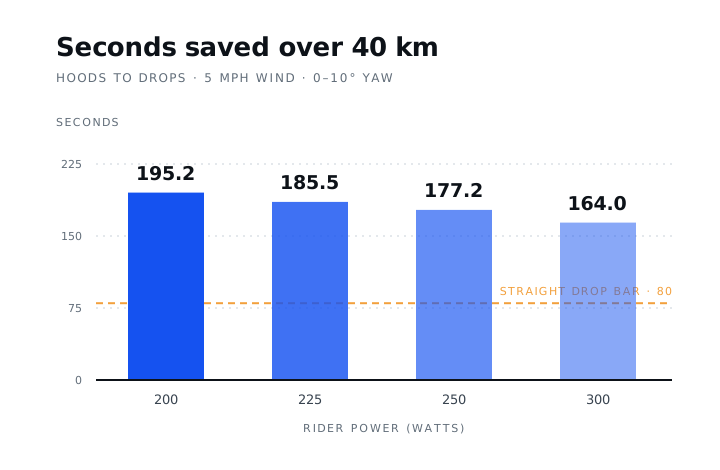
Seconds saved over a 40 km time trial
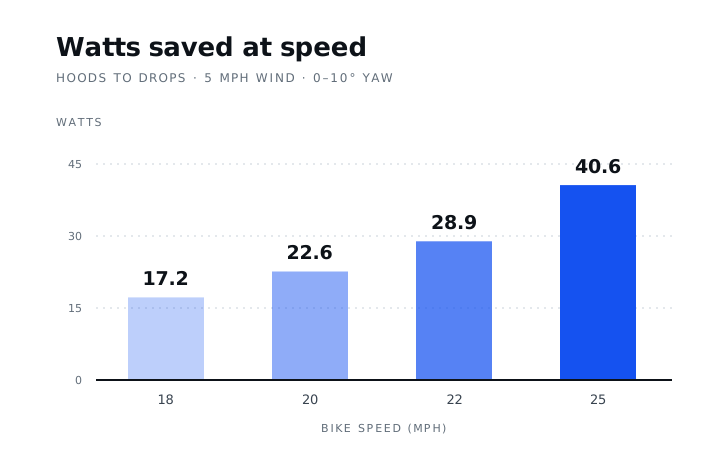
The faster you go,
the more it saves
Savings hood to drops, model 42/33, 5 mph wind and 0–10° yaw. Drag rises with the cube of speed, so the faster you ride, the more watts the position saves — 17 at 18 mph, 41 at 25. Over 40 km that’s 164 to 195 seconds, against roughly 80 for a straight drop bar.
Why the savings shrink as you get stronger
The 300 W number
is our floor
Drag rises with the cube of speed. At 300 W you’re already deep into that wall, so the same reduction in frontal area buys back less absolute time. It’s also a rider who barely exists — very few people hold 300 W for 40 km.
At 200 W, where most of us actually race, the bar returns 195 seconds. A conventional straight drop bar returns roughly 80 on the same move. That’s the number to look at.
How to read these numbers
Same rider. Same bike.
One position change.
Every result is the difference between riding the hoods and riding our drops — nothing else on the bike changed. That’s why we call it free speed: you already own the equipment, you simply gain a position that wasn’t available before.
Source: primary wind tunnel testing. Real savings with typical road gear and rider. Wind tunnel tested. Independently tested to ISO 4210-5 by an accredited laboratory.